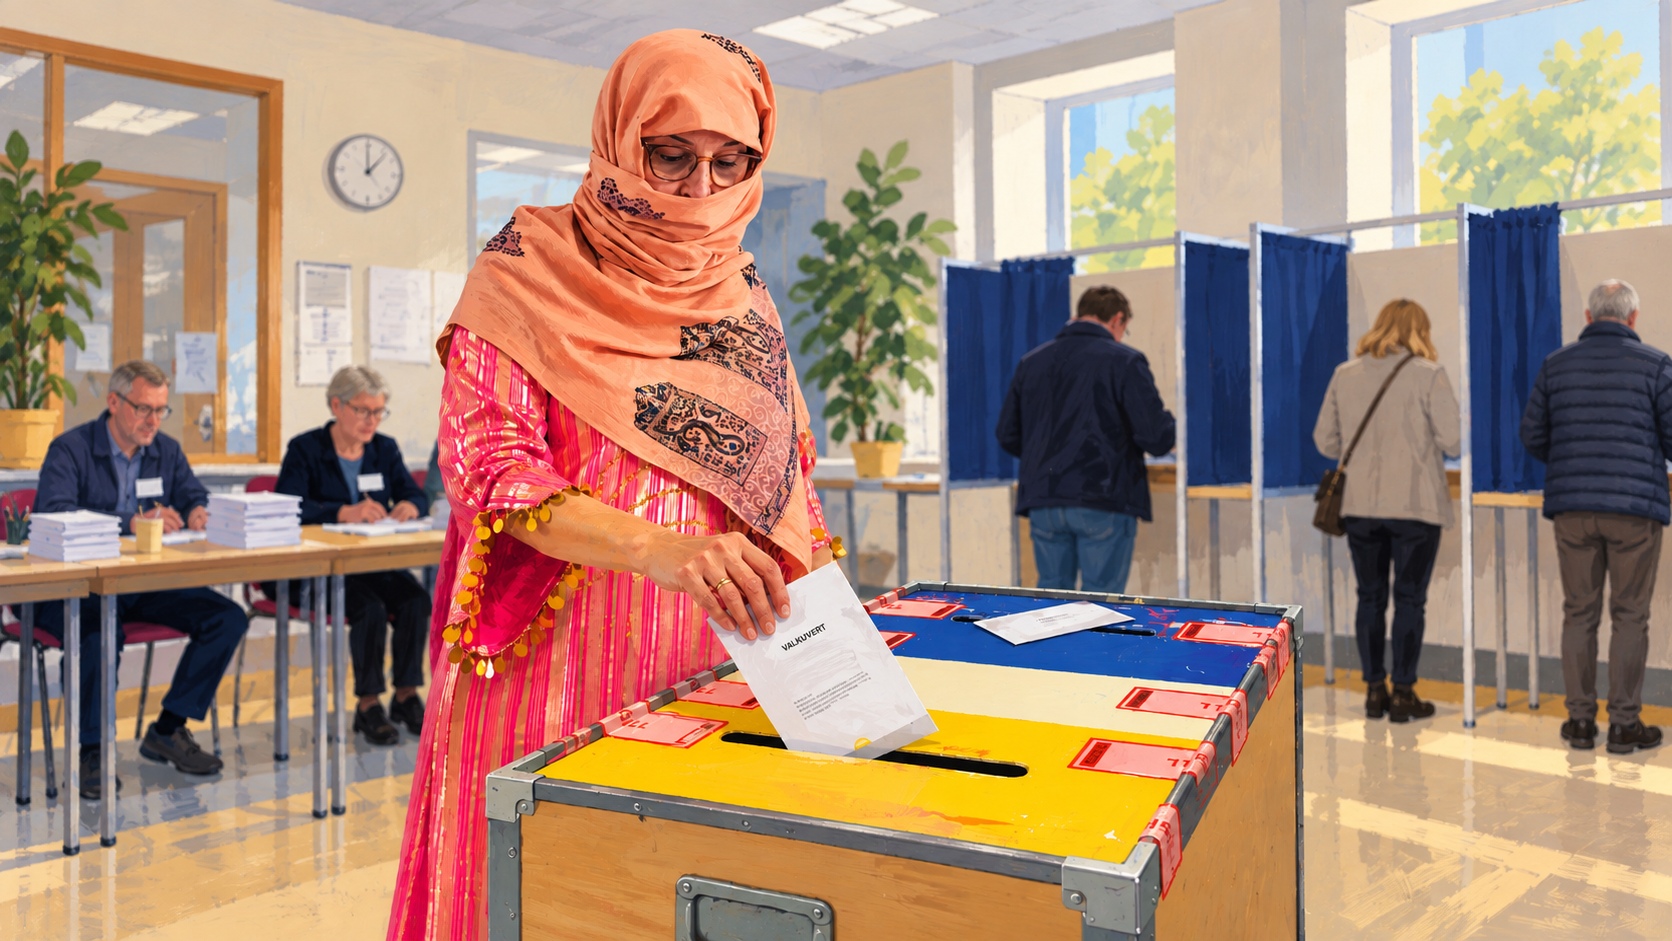
Voter turnout in Sweden’s vulnerable areas rose significantly in this year’s parliamentary election. A new survey of 75 electoral districts shows that participation increased from 54.9 percent in 2022 to 61.1 percent in 2026, an upturn of 6.2 percentage points.
The increase was also very widespread. In 69 of the 75 electoral districts that could be directly compared between elections, a larger share of voters took part than four years ago, reports SVT Nyheter, which conducted the study using police geographical boundaries and official data from the Swedish Election Authority.
Back Toward Pre-2022 Levels
Despite the upturn, the result does not represent a historic record. In the comparable areas, voter turnout was already at 63.6 percent in 2018, before it sharply dropped to 54.9 percent in the 2022 election.
This year’s 61.1 percent is therefore more of a recovery toward the previous levels than a completely new phenomenon. At the same time, turnout still remains well below the national average of 84.9 percent.
The difference from 2022 is still significant enough to correspond to many additional votes being cast in the affected areas. However, determining how these votes were distributed among the parties requires a separate analysis of each district’s results.
The detailed election results and raw data can be found at the Swedish Election Authority, which publishes results, voter turnout, preferential voting, and geographical data at the electoral district level.
Several Possible Explanations
Researchers interviewed by SVT highlight several possible reasons for the increase. Municipalities and non-profit organizations have worked actively to encourage more people to vote, while political parties and religious organizations have also mobilized voters in some areas.
Political scientists also point to issues such as migration, citizenship, and conflicts in the Middle East as possible reasons why the election was seen as particularly important for certain voters. At the same time, more opportunities for advance voting and practical mobilization efforts may have contributed.
However, it is not possible based on turnout alone to determine which groups were responsible for the increase or how they voted. Such conclusions require further data, and results at the area level cannot automatically be translated into individual voting patterns.
75 Districts Could Be Compared Over Time
SVT identified a total of 151 electoral districts where at least 90 percent of the area is located within areas classified by the police as vulnerable or particularly vulnerable. However, since district boundaries changed between elections, only 75 of these could be directly compared between 2018, 2022, and 2026.
This also means the figures do not cover all vulnerable areas in the country. However, they show a clear pattern in the districts where geographical comparisons are possible over time.
The next step is therefore to go down to the same 75 districts and compare the actual number of votes, not just the parties’ percentage shares. This will show which parties actually gained or lost in vote numbers as more people participated, without drawing conclusions about how individual voters acted.