The Sweden Democrats are updating their digital tool, the Migration Map, with several new features. The new version makes it possible to see which municipalities have accepted or declined to meet with the government’s coordinator for voluntary repatriation – and where in the country vulnerable areas are located.
The Sweden Democrats are now presenting an updated version of their web-based tool, the Migration Map. The main new feature of version 2.0 is that users can see how municipalities across the country have responded to the government’s initiative on voluntary repatriation.
The map shows which municipalities have agreed or declined to meet the government’s coordinator—a function which, according to the party, aims to increase transparency and give citizens better insight into local decisions.
New icons for vulnerable areas
Another novelty is that the map now includes visual markers for so-called vulnerable areas where immigration-related problems are particularly severe. With dedicated icons, users can quickly get an overview of where these areas are geographically located.
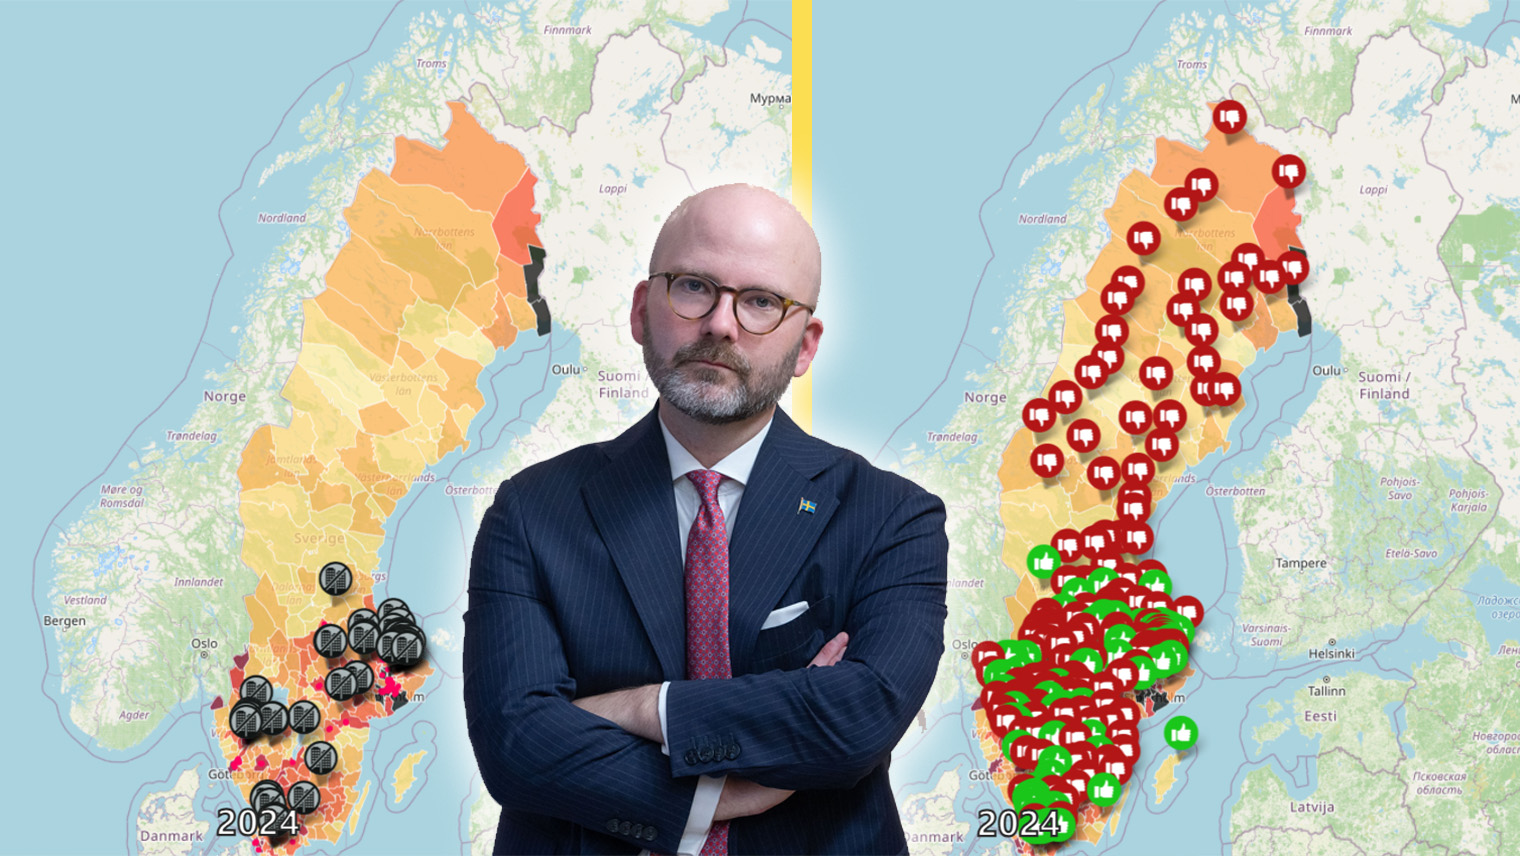
Nu lanserar vi Migrationskartan 2.0
✅ Se vilka kommuner som tackat ja eller nej till att träffa regeringens samordnare för frivillig återvandring.
✅ Nya ikoner visar var utsatta områden finns.
Besök https://t.co/IHF8N8Aegk och dela länken med vänner, grannar och kollegor. pic.twitter.com/qNrXbDqqwy
— Charlie Weimers MEP ???????? (@weimers) April 16, 2026
The purpose is to make the information more accessible and to connect demographic changes with challenges in immigration and integration policy.
A tool for understanding the development
The Migration Map was originally launched as an interactive tool to show how Sweden’s population has changed—municipality by municipality—over the past 25 years. Using data from sources such as Statistics Sweden (SCB), it visualizes the growth in the proportion of foreign-born residents since the year 2000.
Charlie Weimers has previously highlighted that Sweden’s population, due to immigration, has increased by about 1.6 million people since the turn of the millennium. Over the same period, the proportion of foreign-born residents has risen from just over ten to more than twenty percent.
Examples mentioned include Malmö, where the proportion of foreign-born is said to be around 35 percent, and Stockholm, where the corresponding figure is about 25 percent. In other cities, such as Södertälje, ethnic Swedes are in the minority, and in many suburban areas, hardly any ethnic Swedes live there at all.
“Facts as the basis for debate”
According to the Sweden Democrats, the purpose of the map—and its updates—is to make statistics more accessible to the public and thereby contribute to a more fact-based public debate.
READ MORE: SD launches “Migration Map” – shows population changes municipality by municipality
The party believes the tool enables citizens to see for themselves how their municipality is developing, compare with other parts of the country, and form their own opinions.
With the new version, the party also hopes that issues around repatriation and local political decisions become more visible to voters.
A further development
The party describes Migration Map 2.0 as a further development of the existing tool. The focus is on broadening the information content and improving the user’s overview.
By combining statistics, political stances, and geographic markers, the Sweden Democrats aim to create a more comprehensive basis for public discussion about migration and societal development.
Visit the Migration Map HERE.